Art Basel and UBS Art Market Report 2025
Source text · Page 1
ART MARKET REPORT 2025 BY ARTS ECONOMICS THE ART BASEL & UBS
Source text · Page 25
some wealthy collectors hopeful for more favorable tax positions. However, whether this optimism is justified remains to be seen, given that the new administration has already flagged the closure of certain tax loopholes that might negatively affect the net wealth of some high-net-worth individuals (HNWIs).3 Despite the decline over the last two years, the US has been one of the strongest performing markets of the past 20 years (with sales values up by 61% since 2005) and helped drive the market’s recovery both following the pandemic in 2020 and in the contraction during the global financial crisis of 2009. The US remains the largest global hub for the art trade and the center for sales of the highest-priced works to local and international buyers. It therefore depends critically on the relatively unencumbered flow of art and antiques into and out of the market through cross-border trade. Therefore, a new element of concern for the market is the protectionist, anti-trade policies that have been introduced by the incoming government, with a range of tariffs already announced in early 2025. Like other global market hubs, sales in the US are fueled by imports of art and antiques, and after falling dramatically during the pandemic, these doubled in value from their low point of [金额已省略] billion in 2020 to [金额已省略] billion in 2022. However, since then, imports have already seen more subdued growth, advancing by just 1% to [金额已省略] billion in 2023, before a substantial fall of 15% in 2024 to [金额已省略] billion, leaving them down by 25% on pre-pandemic 2019 and by 4% on 10 years previous in 2014. Similarly, after a post-pandemic revival in 2021 and 2022, exports were stagnant in 2023 and fell by 7% to [金额已省略] billion in 2024, also down by 18% on 2019 and roughly at the same level as 2014. While much of the focus for other industries has been on possible tariffs that might be applied on trade with China, these make up a relatively small share of US imports of art and antiques, accounting for just 1% of total values in 2024. However, China is more important for exports, with a 13% share by value in 2024 (the fourth-largest destination market). The US’s largest bilateral trade partners remain the large and mid-sized art markets in Europe, with France, the UK, and Germany accounting for 56% of imports and 41% of exports in 2024, positioning these markets as the most at risk if tariffs are raised. However, any anti-trade policies for imports or exports are potentially damaging to the US art market, which has built its leading position as a key hub for the art trade by relying on both international buyers and sellers of art to complement its sizeable domestic base. (US tariffs and their implications for the art market are discussed in the legal analysis in Exhibit 1.) 3 For example, the Trump administration announced in February 2025 that it planned to end the ‘carried interest loophole’ which allowed favorable tax treatment of certain compensation received by private equity, venture capital, and hedge-fund managers, which some in the art trade feared might affect collectors and donors. The previous Trump administration also closed the 1031 or like-kind exchanges in 2017 which were widely used by collectors to reduce capital gains tax. 25 INDEX ↑ INTRODUCTION 1. THE ART MARKET 2. DEALERS 3. AUCTIONS 4. OUTLOOK
Source text · Page 49
Figure 3. Monthly Number of Trades in Art and PFP NFTs 2021–2024 ©NFT18.com During this period of decline from the frenzy of 2021, many things have changed, not least the nature of the NFT markets. Alongside the downturn in the markets, with the significant drop in prices and liquidity, key economic players in this ecosystem have come under significant pressure. By late 2023 and 2024, some of the historic platforms that were critical to the development of these markets had begun to announce that they would be closing their doors: • KnownOrigin, founded in 2020 and acquired by eBay in 2022, announced that it would close in July 2024; • AsyncArt, which had experienced considerable growth since its launch in February 2020, confirmed its closure in October 2023; and • MakersPlace, one of the first digital art marketplaces, founded in 2018, also announced that it would cease operations in January 2024. Each of these marketplaces has, in its own way, left its mark on the history of NFTs and digital art. AsyncArt, for example, hosted the first collaboration between early cryptoartists in 2020: The First Supper, a collage from XCopy, Coldie, SHORTCUT, BlackBoxDotArt, MLIBTY, Alotta Money, Vansdesign, Hackatao, Rutger van der Tas, Matt Kane, Josie Bellini, TwistedVacancy, and Connie Digital. The technical aspects and the inscription of Beeple's Everydays: the First 5000 Days on the Blockchain in 2021 for the sale at Christie’s was handled by MakersPlace. 49 INDEX ↑ INTRODUCTION 1. THE ART MARKET 2. DEALERS 3. AUCTIONS 4. OUTLOOK
Source text · Page 73
Figure 2.8 Average Turnover of Dealers by Market Sector 2023–2024 ©Arts Economics (2025) An analysis of the annual sales by specific sectors revealed that one of the drivers of the slowdown in aggregate performance was the relatively poorer performance year-on-year of Contemporary art versus previous years, particularly given its dominance in the sample and the wider market. Reversing recent patterns, dealers operating in older sectors such as Modern art and Old Masters reported significantly better year-on-year progress in 2024 than those in Contemporary art. Dealers focused exclusively on Post-War art reported stable results year-on-year, with one of the highest average sales levels of all sectors at [金额已省略]. In contrast, those working only in Contemporary art had a much lower average (just under [金额已省略]) and experienced an 11% drop in sales in 2024. It is notable that the median sales in this segment were relatively stable year-on-year, indicating that the slump was primarily due to performance at the higher end of this sector. These trends signal some continuing risk aversion, with dealers noting that higher prices were concentrated on the most established artists, while newer Contemporary artists were selling well at lower prices. Dealers in the older fine art sectors continued to have higher average turnovers than those dealing in Contemporary art. Although surveying a relatively small sample compared with 73 INDEX ↑ INTRODUCTION 1. THE ART MARKET 2. DEALERS 3. AUCTIONS 4. OUTLOOK
Source text · Page 97
b) By Employee Numbers Figure 2.21 Breakdown of Dealer Operating Costs by Turnover and Employee Numbers 2024 a) By Turnover ©Arts Economics (2025) 97 INDEX ↑ INTRODUCTION 1. THE ART MARKET 2. DEALERS 3. AUCTIONS 4. OUTLOOK
Source text · Page 121
Art Fair Sales Focusing on art fair sales in 2024, as in previous years, the largest share of sales reported at art fairs was for the largest dealers, with the familiar pattern of increasing share as turnover rose. Dealers turning over more than [金额已省略] averaged a share of 34% in 2024 from live events, up by 4% year-on-year, and with the majority (73%) being sales at international fairs, which accounted for all of the gain in share. While this was more than double the share during the pandemic in 2020 in this segment (13%), it was still less than the 40% in 2022, or the peak of 44% in 2019. The share of fair sales also rose in the segment of dealers with turnover of between [金额已省略] and [金额已省略], by around 2%, although in this case it was local fairs that shifted up slightly. The share of fair sales was stable or dropped for dealers in the smaller segments, with the biggest fall for the smallest dealers turning over less than [金额已省略] from 26% to 23%. All segments reported a lower share than in 2019. IMAGE Detail of a work by Emily Kraus, presented by Luhring Augustine in the Galleries sector at Art Basel Miami Beach [电话已省略] INDEX ↑ INTRODUCTION 1. THE ART MARKET 2. DEALERS 3. AUCTIONS 4. OUTLOOK
Source text · Page 145
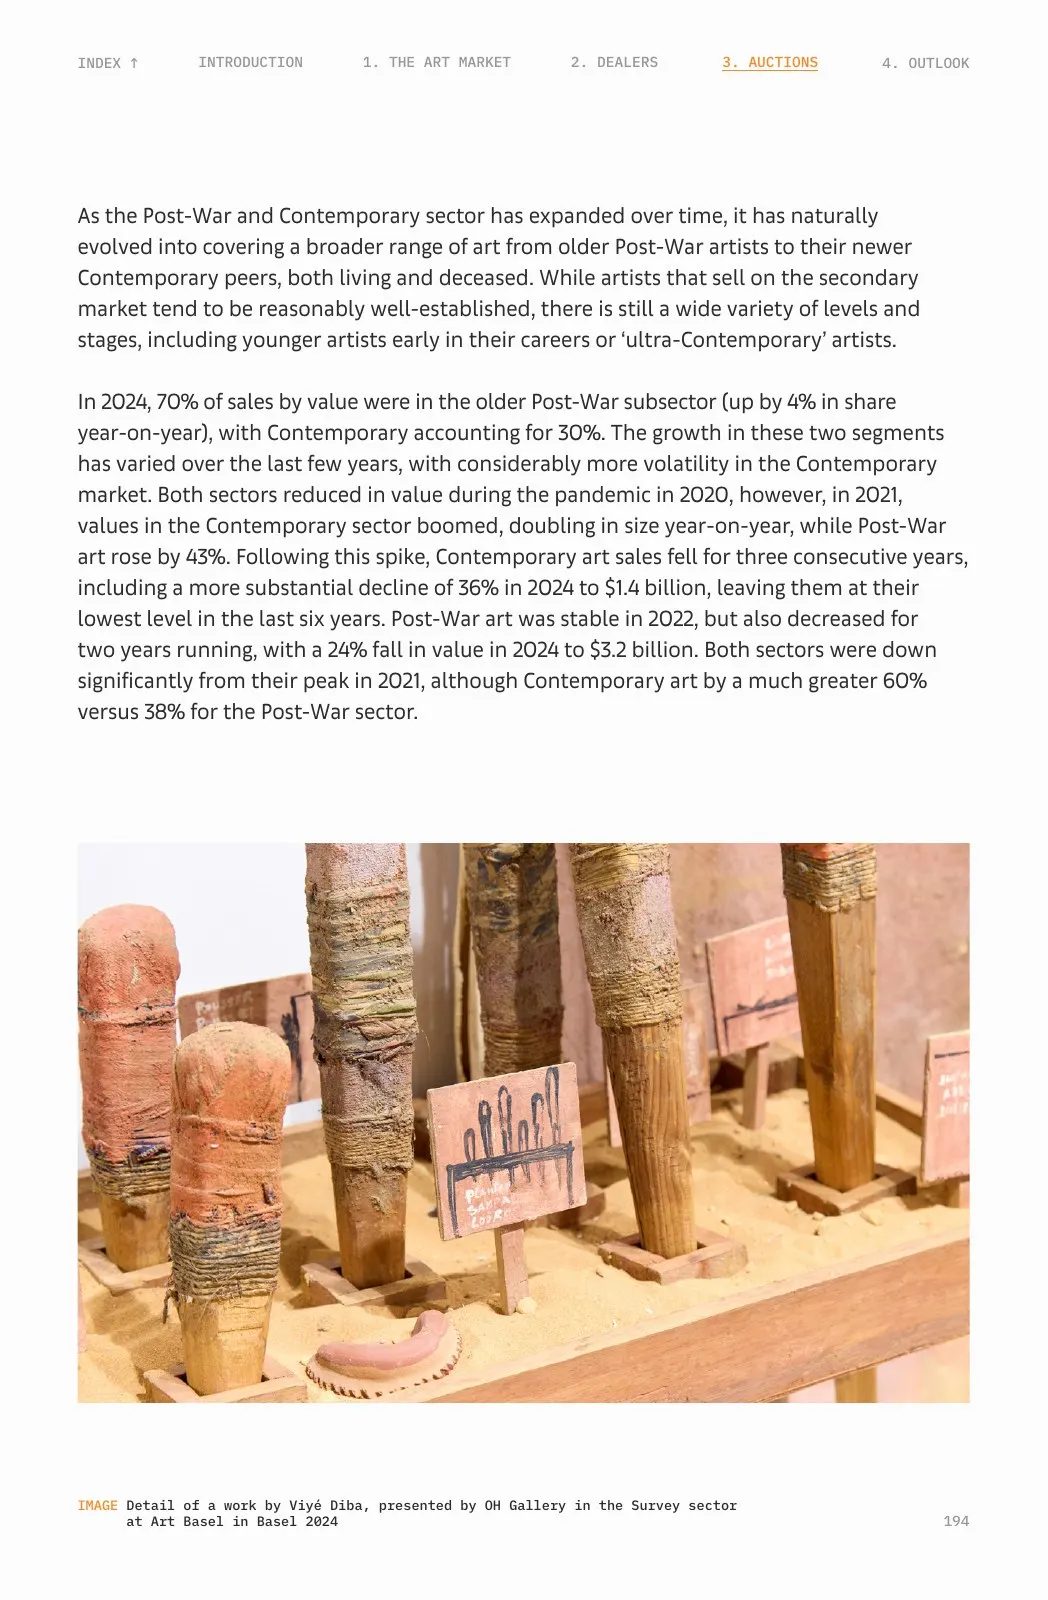
IMAGE Detail of a work by Pauline Curnier Jardin, presented by Ellen de Bruijne Projects in the Galeries sector at Art Basel Paris 2024 145 INDEX ↑ INTRODUCTION 1. THE ART MARKET 2. DEALERS 3. AUCTIONS 4. OUTLOOK
Source text · Page 169
Phillips continued to be successful at attracting new buyers, with 31% of buyers at auction new to Phillips in 2024. This followed a strong year in 2023, with 50% of buyers using live and online-only auction channels being new to the company. The share of new buyers through private sales channels was even higher in 2024 at 77%, and the share of sales to new buyers was 26% of total sales. Phillips held public auctions and selling exhibitions in the US, the UK, France, Seoul, Hong Kong, and Switzerland in 2024. The US accounted for the largest share by value, with 43% of their total public auction sales in 2024 hosted in New York, from 48% in 2023. A further 21% of the company’s public sales were held in Asia, with the remaining 36% in Europe, including 17% in the UK. Like their peers, online-only sales fared better than live sales in 2024, with a reduction of 9% year-on-year to [金额已省略], accounting for 4% of total public auction sales values. While they held around 10 fewer online-only sales in 2024 than the previous year, these sales have significantly increased in number since prior to the pandemic, from 10 in 2019 to 26 in 2024, and their values have grown to more than seven times their size. The number of live sales was more stable at 69 and Phillips conducted more sales overall in 2024 than in 2019. After reaching an historical peak of sales in 2023 at [金额已省略] billion, Bonhams posted sales across all segments of their business of [金额已省略] in 2024. Just over 70% of the lots sold during the year were online-only sales, making up 20% of total auction sales by value (excluding their auction houses in Sweden and Denmark). Bonhams’ sales in Hong Kong went against the declining trend in the top-tier houses, too, seeing double-digit growth of 18% to [金额已省略]. After posting some strong results in 2023, following the reopening of the economy from lockdowns early in the year, the top-tier auction houses in Mainland China experienced a challenging year in 2024. China Guardian was the largest auction house in Mainland China, with stated sales of [金额已省略], down by just over one-third in value from 2023 ([金额已省略]), and significantly lower than before the pandemic in 2019 when their reported total was [金额已省略]. Part of the drag on growth was the decline in the sale of highly priced lots, with the number selling for over 10 million RMB ([金额已省略]) falling from 78 to 46. Despite the downturn in sales, the company noted that they saw a strong uptick in new buyers, with 20% of their buyers purchasing for the first time in 2024. Poly Auction saw sales fall by an even greater 67% in value year-on-year to [金额已省略] in 2024 (from [金额已省略] in 2023, and [金额已省略] billion in 2019). Most of these sales took place in 169 INDEX ↑ INTRODUCTION 1. THE ART MARKET 2. DEALERS 3. AUCTIONS 4. OUTLOOK
Source text · Page 193
3.6 Post-War and Contemporary Art Post-War and Contemporary art remained the largest sector of the fine art auction market in 2024, with a share of 52% of the value of global sales and 54% by volume, both down by 1% on 2023. Aggregated sales in the sector reached [金额已省略] billion, down by 28% year-on-year and representing the third consecutive year of declining values from the peak of [金额已省略] billion in 2021. The volume of transactions in the sector fared considerably better, with a rise of 5% in the number of lots sold in 2024, reaching their highest level of transactions in 10 years. After falling substantially during the global financial crisis to a low of [金额已省略] billion, the sector recovered rapidly over five years, reaching a high of [金额已省略] billion in 2014. The next few years showed mixed results, and sales had already begun to decrease in 2019 prior to the pandemic due to reduced supply in the [金额已省略]-plus segment. During 2020, sales fell by 18%, but recovered strongly again, achieving a record high of [金额已省略] billion in 2021, up by over 60% year-on-year and surpassing the previous peak in 2014. From this peak, after three years of declining sales, values in 2024 were at their lowest point since 2010, although still more than double the size of the market in 2009. Figure 3.19 The Post-War and Contemporary Art Sector 2014–2024 ©Arts Economics (2025) with data from Artory 193 INDEX ↑ INTRODUCTION 1. THE ART MARKET 2. DEALERS 3. AUCTIONS 4. OUTLOOK
Source text · Page 217
Figure 3.34 Sales in the Impressionist and Post-Impressionist Sector by Price Segment 2024 ©Arts Economics (2025) with data from Artory Sotheby’s and Christie’s again dominated sales by value, with a share of 58% in 2024, and Sotheby’s slightly larger at 31%. This combined share was stable on 2023, but down from 85% in 2022 (with Christie’s given a substantial boost that year to 64% through the Paul Allen sale). Along with China Guardian, Bonhams, and Kornfeld, the top five auction houses accounted for 68% of the value of sales and 15% of the number of works sold in the sector. 217 INDEX ↑ INTRODUCTION 1. THE ART MARKET 2. DEALERS 3. AUCTIONS 4. OUTLOOK
Source text · Page 241
recover more easily from the pandemic than it otherwise might have. It also suggests that slowdowns at the highest end of the market experienced for the last two years were not entirely driven by a lack of wealth. While the expansion of HNW wealth may be a necessary condition for a stronger growth in sales, it is clearly not sufficient alone. Figure 4.1 Global Billionaire Population and Wealth (December T otals 2008–2024) ©Arts Economics (2025) with data from Forbes 241 INDEX ↑ INTRODUCTION 1. THE ART MARKET 2. DEALERS 3. AUCTIONS 4. OUTLOOK
Source text · Page 265
Rights All rights reserved. No part of this publication may be reproduced, stored in a retrieval system, or transmitted, in any form, or by any means, such as electronic, mechanical, or otherwise without the prior written consent of Art Basel and UBS. UBS accepts no liability for the actions of third parties in this respect. Disclaimer This report is provided solely for information purposes and has not been tailored to the specific needs, investment objectives, or personal and or financial circumstances of any recipient. Neither UBS AG nor any of its affiliates have verified the accuracy of the information or make any representations, endorsements of the author(s), or warranties as to the accuracy or completeness of the information. The report is not intended to be regarded as investment research, a sales prospectus, an offer, or solicitation of an offer to enter into any investment activity. It is not to be construed as legal, tax, accounting, regulatory, or other specialist or technical advice, or investment advice and neither UBS nor any of its affiliates accept any liability for any loss or damage arising out of the use of or reliance on all or any part of the information provided in the report. © UBS 2025. The key symbol and UBS are among the registered and unregistered trademarks of UBS. All rights reserved. P24 ID: 4361274