The-Art-Basel-and-UBS-Art-Market-Report-2026-by-Arts-Economics-2
正文与记录 · 第 1 页
ART MARKET REPORT 2026 BY ARTS ECONOMICS THE ART BASEL & UBS
正文与记录 · 第 23 页
1.2 Regional Market Performance Aggregate sales by value remained concentrated in the three largest markets – the US, the UK, and China – which together accounted for 76% of the global market in 2025 (stable year-on-year). Although the base of buyers in the market has become more internationally dispersed, reflecting wealth growth in emerging economies and a wider geographic distribution of transactions, these centers continue to anchor the majority of the market’s value. However, their combined share – while still a significant majority – was the lowest in a decade, driven in part by China’s declining share and rising activity in other Asian and emerging markets. This reflects both the expansion of sales in newer markets and improved measurement of their activity. However, the implications for the long-term geographic distribution of the market remain uncertain. While the market’s growth has been supported by global and cross-border trade, survey evidence from dealers and auction houses in 2025 suggests that many businesses increased their emphasis on domestic sales, as cross-border trade policies and restrictions, logistical costs, and administrative complexities impacted international transactions. Figure 1.3 Global Art Market Share by Value 20251 © Arts Economics (2026) 1 Percentages presented throughout the report are rounded a nd reported to their nearest integer (apart from those less than 0.5%). In some cases, therefore, the integers in charts do not sum to 100% (but sum to 99% or 101%) due to rounding. 23 INDEX ↑ INTRODUCTION 1. THE ART MARKET 2. DEALERS 3. AUCTIONS 4. OUTLOOK
正文与记录 · 第 46 页
2.1 The Dealer Sector in 2025 After two years of decline, sales in the dealer sector shifted to a positive trajectory in 2025, with an estimated increase of 2% globally to [金额已省略] billion. Although this represented a more stable performance overall, the growth patterns between regions and segments continued to be mixed, with the most buoyancy remaining at the lower end of the market. Sales by dealers had contracted by an estimated 20% during the pandemic in 2020, but recovered strongly in the two years that followed. Strong sales in the high end and across multiple channels drove growth, and values returned to pre-pandemic levels by 2022. However, after two years of intense spending, the market slowed in 2023. Global economic and geopolitical uncertainties were widely blamed for greater price sensitivity at the top of the market, and dealers saw a markedly more risk-averse and price-sensitive buying climate emerge. Values fell 3% in 2023, with a further drop of 6% in 2024, as market confidence remained subdued at higher levels despite considerable buoyancy and higher volumes at lower prices. These two years of decline brought sales in the sector to [金额已省略] billion, 8% below its value in 2019. The higher end of the dealer sector started to slowly pick up again in 2025, particularly in the second half of the year, according to dealers operating in these segments, with a small but positive uptick in aggregate sales. However, some segments were still under pressure, and many continued to report the challenges of persistent inflation in costs outpacing sales growth and compressing margins, against a backdrop of slower and more uneven sales. The higher end of the dealer sector started to slowly pick up again in 2025, but some segments were still under pressure 46 INDEX ↑ INTRODUCTION 1. THE ART MARKET 2. DEALERS 3. AUCTIONS 4. OUTLOOK
正文与记录 · 第 68 页
Sales Volumes As sales slowed over 2023 and 2024, the number of transactions carried out by dealers remained relatively stable, indicating a shift to lower-priced sales. This continued in 2025, with a 5% increase in the volume of sales – from 139 to 146 works on average – outpacing the growth in value. The average volume of transactions is skewed upwards by dealers selling a high number of objects and multiples, and the median is therefore often more representative of the level of sales for most businesses. The median number of works sold in 2025 was 75, which has remained stable for the last two years. The median ranged from 35 for those with turnover of less than [金额已省略] up to 175 for dealers with turnover of greater than [金额已省略]. Across dealers of differing turnover levels, nearly all segments reported an increase in the average number of transactions in 2025. The exception was businesses turning over [金额已省略] to [金额已省略] where the number was stagnant (having also been the one segment to experience falling volumes in 2024). This was notable, as this segment also saw one of the largest increases in aggregate values year-on-year. Among the 43% of dealers in this segment that recorded rising values, transactions increased by 19%. However, their average transaction volume was lower than the remaining 57% reporting stable or falling turnover, whose volume declined by 12%. The largest increase in transaction volume was for dealers with turnover of less than [金额已省略] with a rise of 15% The largest increase in transaction volume was for dealers with turnover of less than [金额已省略] with a rise of 15%, from an average of 74 to 85. Other segments saw more moderate changes, including an increase of 3% (from 279 to 284) for those largest dealers with turnover in excess of [金额已省略]. 68 INDEX ↑ INTRODUCTION 1. THE ART MARKET 2. DEALERS 3. AUCTIONS 4. OUTLOOK
正文与记录 · 第 90 页
Dealers also reported on how each element of their costs had increased or decreased over the last year. The three main areas of inflation were the same as in 2024. The largest escalation in costs related to packing, shipping, and logistics, which were up by an average of 10%, following a rise of 15% in 2024. Art fair costs saw the second highest rise of 9% (with a 10% increase reported in 2024), while travel and accommodation costs were up by 6% (versus a steeper 11% reported in 2024). Many dealers commented that inflation in these areas affected their businesses over the year, particularly when participating in international events: “Travel expenses, accommodation costs, and transportation (such as taxi fares) have surged, making it difficult to turn a profit when participating in events due to excessive costs.” “Art fair and transport costs are no longer in proportion to the potential revenue prospects. We feel compelled to organize only one transport and production-intensive exhibition at our premises in the next two years (or longer). Art fair participation will also be reduced by 20% and additionally evaluated in terms of the respective shipments.” “Accommodation costs at destinations have roughly doubled. We are struggling to control expenses amid rising prices.” “Transportation costs, particularly those associated with acquiring works from overseas artists and shipping pieces to international customers, have risen excessively. This makes it difficult to approach overseas artists and results in higher prices for overseas customers due to shipping fees.” “Shipping costs have skyrocketed. The logistical landscape is more complex and difficult.” Many also commented on currency exchange issues, notably the volatility in exchange rates with the US dollar. Specific regional issues, including Brexit and US tariffs and regulations, also affected costs. “Significant increases in gallery operating costs due to inflation, coupled with a depreciation in exchange rates, have substantially impacted operations through higher costs for participating in overseas art fairs and shipping works abroad. As substantially raising artwork prices is impossible, no realistic solution is currently apparent.” “Weakening exchange rates caused overseas fair and shipping costs to rise substantially when converted to dollars, leading to us canceling European and American fair participation. Our activities are now centered on Asia.” 90 INDEX ↑ INTRODUCTION 1. THE ART MARKET 2. DEALERS 3. AUCTIONS 4. OUTLOOK
正文与记录 · 第 112 页
Dealers had many comments on their experiences with art fairs in 2025, with much of the discussion focused on rising costs, and balancing the investment in the fair exhibition itself – along with travel, shipping, marketing, and hospitality – with the returns through sales and client leads. Many dealers noted that this balance had become difficult to reconcile over the last few years as fair exhibitions and particularly shipping and travel had become “insanely expensive” while profits were more uncertain. This led to some to cut back and focus only on the fairs that generated returns. Some dealers also explained how the rising costs had made margins in certain sectors more difficult, particularly for mediums at lower price points such as photography, prints, and digital art, as opposed to paintings and sculpture, where prices might more easily cover costs even if the volume of sales was lower. “Fairs have become so expensive, we cannot experiment with them anymore. We only participate if we are confident we can make our money back.” “Art fairs continue to be a very important moment to connect with international clients, curators, and museums, as well as home-based clients from our own city that rarely make it to the gallery. The social aspect and experiencing works in person are clearly driving forces. However, we have to seriously consider the amount we can participate in due to the costs of the stand fees, shipping, accommodation, and extras in relation to the price point of works in a gallery of our size, which often leaves us scratching our heads after the final figures are drawn up. We sell at the fairs and do well but a lot of the time it’s not enough to justify the huge expenses involved.” “Fairs have become a story of diminishing returns, with their consolidation, the new owners are extracting short-term value from galleries, providing less and less in return, with little care for long-term relationships with galleries or collectors.” “The increased cost of transporting artworks and cash-flow challenges make participation in multiple art fairs difficult for small businesses like ours. Despite most of our clients being based outside our home country, we feel that for 2026, we need to focus on fairs in our home market.” “The prices at international art fairs are designed for galleries that participate fully in the global northern market – for that price level. Countries such as ours, where there is a rich history of Modern and Contemporary art in the avant-garde and of great intellectual and formal sophistication, have fewer millionaires and therefore a much smaller and more limited art market, so the prices of works are considerably lower, even for works by canonical 112 INDEX ↑ INTRODUCTION 1. THE ART MARKET 2. DEALERS 3. AUCTIONS 4. OUTLOOK
正文与记录 · 第 135 页
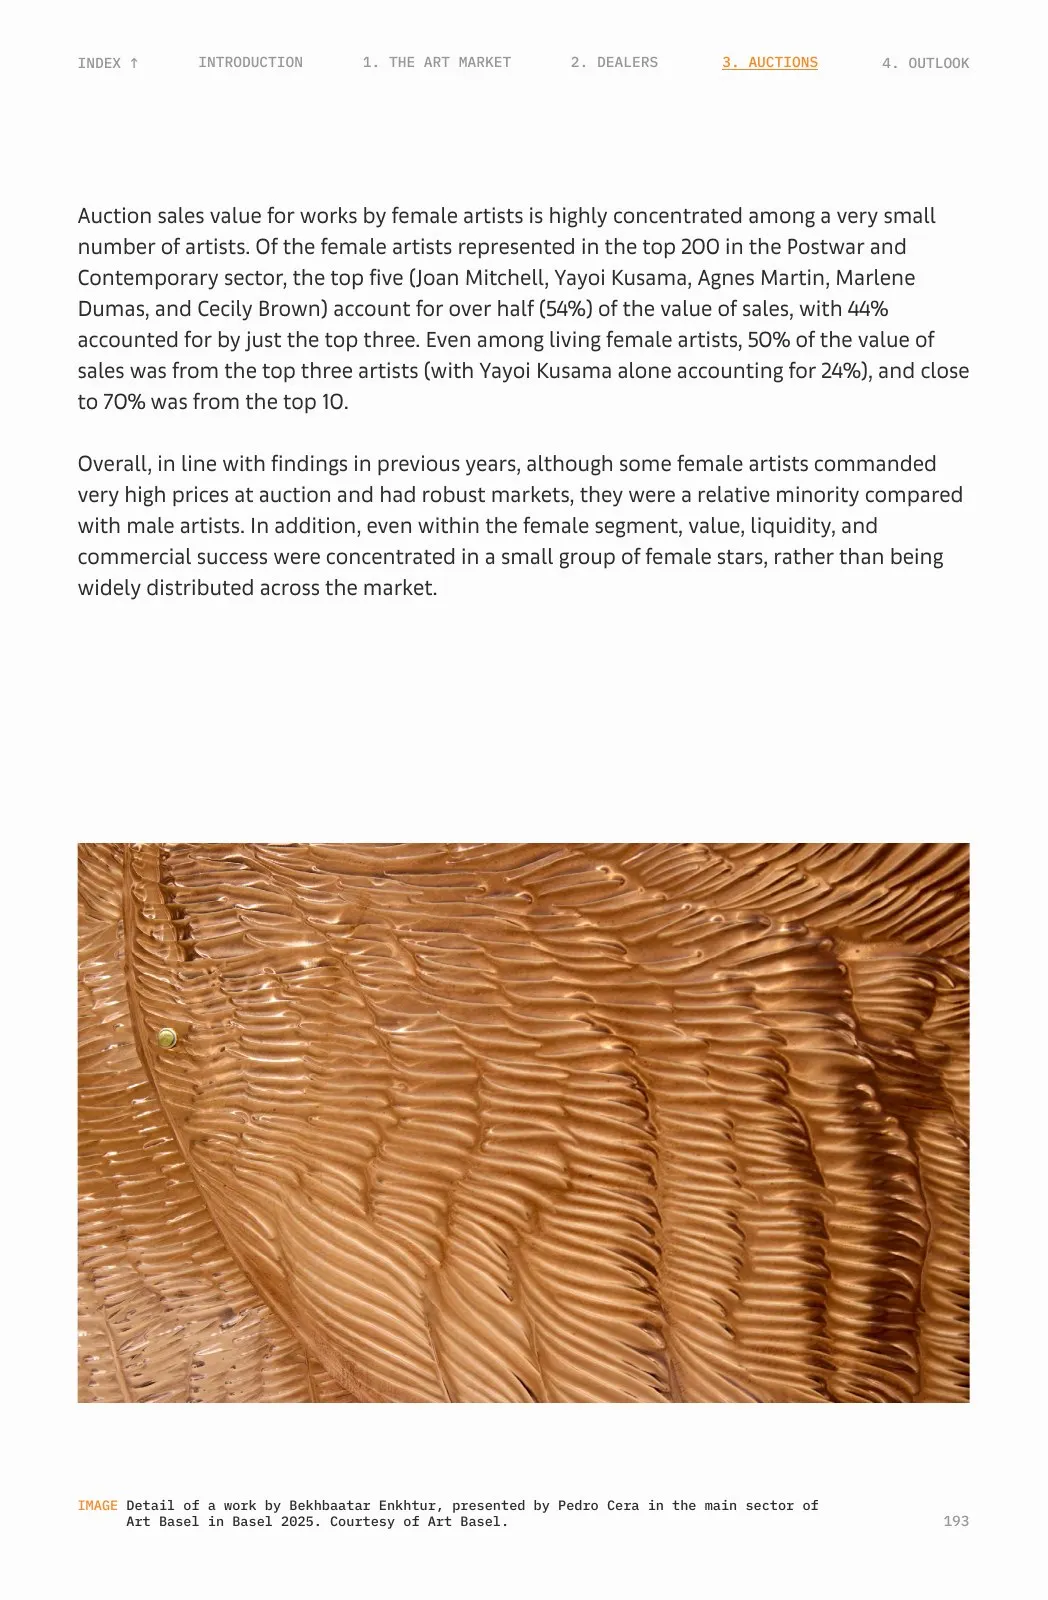
IMAGE Detail of a work presented by neugerriemschneider in th e main sector of Art Basel Miami Beach 2025. Courtesy of Art Basel. 135 INDEX ↑ INTRODUCTION 1. THE ART MARKET 2. DEALERS 3. AUCTIONS 4. OUTLOOK

正文与记录 · 第 157 页
3.3 Mid-Tier Auction Houses While the top-tier auction houses account for a large share of the value of sales in the sector, a significant proportion of sales takes place at smaller auction houses, including an important tier of over 500 medium-to-large businesses. These mid-tier auction houses operate across a range of categories, with a high volume of sales, often at lower prices than the top-tier businesses. Some of these companies are the leading auction companies in their local markets and sell to domestic and international buyers. Aggregate sales totals are estimated using the published results of public auction sales. To deepen the analysis of how these mid-tier businesses fared over 2025 – and to understand the challenges they faced – a survey was sent to leading companies in the sector, with responses from around 100 businesses. The survey indicated much greater stability in the sector in 2025. Just under half of the respondents (49%) reported stable sales year-on-year, up from 21% in 2024, while those reporting declines dropped from 37% to 12%. The remaining 39% saw an increase, down 3% year-on-year, and from 59% in 2023. The companies responding to the survey tended to be well established, having been in business for an average of 39 years. The majority (81%) operated from a single premises, while 16% had multiple regional or international locations. The remaining 4% operated without a dedicated salesroom, most commonly running online-only auctions. They ranged in size by number of employees, from small businesses of fewer than 10 people to those with just over 100 employees. The average was 24 employees, up by one on similar surveys in 2023 and 2024. The majority (56%) kept employment stable in 2025, and 35% increased numbers, the same share as in 2024. Only 8% downsized during the year. As in the dealer sector, many auction businesses have come under pressure in recent years, with escalating costs set against more variable and lower-priced sales. Payroll was by far the biggest operating cost for businesses in this segment, accounting for 40% of total costs, up by just 1% on the share reported in 2024 but by 6% since 2021, and a higher share than in the dealer sector. Rent and mortgages accounted for 13% (down 3% year-on-year). Other major items included external IT services and third-party platform costs (12%); external advertising, PR, and marketing (9%); and packing and shipping (5%). 157 INDEX ↑ INTRODUCTION 1. THE ART MARKET 2. DEALERS 3. AUCTIONS 4. OUTLOOK
正文与记录 · 第 179 页
The Postwar subsector was more than twice the size of Contemporary art and the largest fine art auction sector overall, accounting for 31% of sales by value, although this was down 4% year-on-year. Modern art was again the second largest at 24%. Impressionist and Post-Impressionist art sales took third place at 19% – an increase of 5% in share as sales rose considerably in the sector, buoyed by a number of the highest-priced sales of the year. Contemporary art sales lost share by value in 2025, down 1% year-on-year to 14%. Shares by volume in 2025 were all stable year-on-year, with Postwar art having the highest share (35%), followed by Modern (25%) and Contemporary art (19%). IMAGE Detail of a work by Poppy Jones, presented by Herald St . in the Kabinett sector of Art Basel Hong Kong 2025. Courtesy of Art Basel. 179 INDEX ↑ INTRODUCTION 1. THE ART MARKET 2. DEALERS 3. AUCTIONS 4. OUTLOOK
正文与记录 · 第 201 页
Picasso regained first position in the Modern sector in 2025 in terms of aggregate sales values, with four works in the top 10 lots and seven in the top 50. After his market dropped to almost a third of its size in 2024, works by Picasso increased by 47% in 2025 to reach [金额已省略], with five works selling for over [金额已省略]. René Magritte had his highest-grossing year ever at auction in 2024, but shifted back to second place as sales fell 45% to [金额已省略]. Despite the fall in sales, he still had nine works in the top 50 in the sector, with seven of those selling for more than [金额已省略]. Alberto Giacometti was third, with sales of [金额已省略] – a fall of 15%. The top five artists (which also included Marc Chagall and Zhang Daqian) comprised 32% of the sector by value (from 38% in 2024 and 42% in 2023) and the top 20 artists represented a stable 57% of the total value (and 14% of lots). Sales value in the Modern art sector remained much more concentrated than the Postwar and Contemporary art sector, where the top 20 artists accounted for 36% of value. Christie’s and Sotheby’s accounted for a combined 63% of sales by value in the Modern art market (up 5% year-on-year), with Christie’s having a larger share of 37%. Along with China Guardian, Bonhams, and Kornfeld, the top five houses were responsible for 72% of the aggregate value of sales in 2025, but just 13% of the lots sold. Figure 3.27 Sales in the Modern Art Sector by Price Segment 2025 © Arts Economics (2026) with data from Winston Artory Group 201 INDEX ↑ INTRODUCTION 1. THE ART MARKET 2. DEALERS 3. AUCTIONS 4. OUTLOOK
正文与记录 · 第 224 页
for growth and development. The uncertainty associated with these measures has weakened business confidence and investment sentiment globally, including within the art market, where it influenced pricing and supply conditions. In the broader global economy, despite the rise in tariffs and the volatility they brought, trade remained remarkably resilient in 2025, with early estimates of positive growth driven in part by stockpiling earlier in the year in anticipation of policy changes.43 While trade did not slow substantially, there was evidence of reorientations in some industries and a move to focus more on regional networks (or “near-shoring”), as well as a greater emphasis on political alignments over purely cost-based or economic ones (or “friend-shoring”). For the art market, indicators so far are that cross-border trade was also stable in 2025. Annual import and export statistics are reported with a considerable lag by some regions. Based on around 50 markets with full data available for the first nine months of 2025, global imports of art and antiques were virtually unchanged year-on-year (falling marginally by 0.02%), while exports grew by 5%. Imports to the US grew 4%, while exports fell by 3%, resulting in a deterioration of the trade balance (a reduction in net exports). As noted in Chapter 1, this was amplified further in the full year 2025 data which showed growth in imports of 13% against a 1% fall in exports. The UK saw a similar but more pronounced shift, with imports up 47% and exports down by 39% in the nine month period. While these changes reflect a variety of factors – including currency exchange rates and the specifics of individual sales – they imply that domestic market activity and local buying held up better than foreign buying in both the US and UK. This may also indicate reduced re-export activity from these markets, consistent with a more decentralized and dispersed pattern of trade in which more transactions bypass these hubs. In the other major hub of Hong Kong, net exports increased, with a 9% decline in imports and a substantial 27% increase in exports. This could indicate weaker demand among collectors in Hong Kong for art from international markets, alongside more active selling by dealers and vendors into international markets. Exports from Hong Kong to the US in the first nine months of 2024 accounted for just under half (49%) of total exports, but in 2025 this fell to 36%. Over the same nine-month period, Hong Kong’s total exports rose by 5% year-on-year, while exports to the US fell by 22%, indicating diversification away from the US toward other regions. 43 Trade data is not yet reported by all countries for 2025, but the World Trade Organization estimates that imports of goods worldwide grew at around 2.4%, with stronger than expected growth in the first half of the year due to front loading of imports, strong demand for AI- related products, and trade growth between developing economies. They expect growth in 2026 to be less than 1%. See WTO (2025) “Large Increase in New Tariffs but also Measures to Ease Global Trade”, available at wto.org. 224 INDEX ↑ INTRODUCTION 1. THE ART MARKET 2. DEALERS 3. AUCTIONS 4. OUTLOOK
正文与记录 · 第 246 页
Rights All rights reserved. No part of this publication may be altered or reproduced, otherwise published or stored in a retrieval system, or transmitted, in any form, or by any means, such as electronic, mechanical, or otherwise without the prior written consent of Art Basel and UBS. UBS accepts no liability for the actions of third parties in this respect. Disclaimer This report is provided solely for informational purposes and has not been tailored to the specific needs, investment objectives, or personal and or financial circumstances of any recipient. Neither UBS AG nor any of its affiliates makes any representations or warranties about the accuracy or completeness of the information therein and this report is not an endorsements of the author’s views or opinions. The report is not intended to be regarded as investment research, a sales prospectus, an offer, or solicitation of an offer to enter into any investment activity and also should not to be construed as legal, tax, accounting, regulatory, or other specialist or technical advice, or investment advice; neither UBS nor any of its affiliates accept any liability for any loss or damage arising out of the use of or reliance on all or any part of the information provided in the report. © UBS 2026. The key symbol and UBS are among the registered and unregistered trademarks of UBS. All rights reserved.