The Art Basel and UBS Art Market Report 2023
正文与记录 · 第 1 页
THE ART MARKET 2023 A report by Art Basel & UBS
正文与记录 · 第 24 页
produced a much more uncertain outlook. The more pessimistic context created greater risk aversion on behalf of vendors, reports of thinner bidding at some auction sales, and more cautious and slower transacting in the private sector. This may have, in part, contributed to the better performance of dealers in 2022, as the uncertain and less positive outlook steered buyers and sellers more into the private sector. At the same time, within each of these diverse segments of the market, the performance of businesses was varied. As is commonly seen in times of uncertainty, the very top end of the market was less affected, with wealthy buyers anchoring onto the most established artists and works they perceived to be lower risk and greater stores of value. Combining all sales of auction houses (both private and public), the auction sector accounted for 45% of the value of sales in 2022, down by 2% in share year-on-year, while dealers and galleries (including all online and offline retail sales of art and antiques in the primary and secondary markets) were at 55%. As always, the division between public and private sales varies widely between different regions and sectors. The boundary between these segments has also become less defined and 2022 saw companies in each sector encroaching further into what were once more traditionally segregated parts of each market. A detailed analysis of the dealer and gallery sectors based on surveys and other research in 2022 is given in Chapter 2, while Chapter 3 examines the auction sector, focusing on sales at public auctions. The volume of transactions through the auction and dealer sectors also fell sharply during the pandemic by an estimated 23% to 31.4 million in 2020, but recovered in 2021, with the number of sales rising by 19% to 37.3 million. The number of transactions increased marginally in 2022 by just 1% to 37.8 million, with the rise largely due to more dealer sales as transactions in the fine art auction sector shrank. A significant volume of sales also continued to happen outside the traditional art market, both offline and through online platforms supporting direct sales from artists, creators, and resellers. Art-related sales on non-fungible token (NFT) platforms are not included in the figures for the art market’s sales in 2022 but are discussed in more detail in Section 1.4. INDEX ↑ INTRODUCTION 1. THE ART MARKET 2. DEALERS 3. AUCTIONS 4. OUTLOOK 24
正文与记录 · 第 48 页
Marketplaces and Metaverses – New Spaces for Dealers, Same Issues As of today, sellers can make NFTs available for sale on NFT marketplaces, such as OpenSea, Magic Eden, Blur, Rarible, Nifty Gateway, and SuperRare, which is the most common way for individuals to buy and sell NFTs using their personal digital wallets. Typically, these NFT marketplaces charge a transaction fee for users to buy and sell on their platforms, although growing competitive pressure has led many to reduce or eliminate fees.¹⁴ Creators have also relied on NFT marketplaces to help enforce secondary transaction fees payable to creators (or ‘royalty fees’ which can reach 5% to 10% of the gross price of each transaction). However, because royalty payments have proven difficult to enforce among tokenholders, many NFT marketplaces have begun to accommodate more optionality in royalty payment arrangements between creators and collectors, while also helping to advance the development of NFT technical standards that would empower creators to limit royalty payment circumvention through blockchain-based code.¹⁵ Given the evolving nature of marketplace fees and royalties, sellers and art galleries should be mindful of NFT marketplaces’ royalty policies when choosing whether or not to sell on particular platforms. Alternatively, some art galleries have started opening separate galleries in different metaverses, virtual spaces where users can interact with 3D digital objects, to display the digital art linked to the NFT for virtual visitors. For example, in June 2021, Sotheby’s opened its first virtual art gallery in Decentraland, which is a well-known 3D virtual world, browser- based platform. Other virtual NFT galleries include: KnownOrigin and Narra Gallery in Decentraland, B.20 Gallery and Async Gallery in the Voxels metaverse, as well as oncyber, Spatial, and Museum of Crypto Art (MOCA).¹⁶ For these virtual NFT art galleries, sellers and art galleries should similarly be conscious of the various transaction fees and royalty payments. 14 See for example, Thompson, C. (2023) 'OpenSea Goes Zero-Fee, Creator Royalties Optional.' CoinDesk, available at: coindesk.com/web3/2023/02/17/opensea-goes-zero-fee-creator- royalties-optional. 15 Gilbert, J. and Hernandez, O. (2022) 'How NFT Royalties Work – and Sometimes Don’t.' Blockworks, available at: blockworks.co/news/nft-royalties-sometimes-they-work- sometimes-they-don’t. Further information is also available at The Royalty Registry (royaltyregistry.xyz). 16 Borg, J. (2022) ‘8 NFT Galleries for Viewing Digital Art.’ NFTEvening, available at: nftevening.com/8-nft-galleries-for-viewing-digital-art. INDEX ↑ INTRODUCTION 1. THE ART MARKET 2. DEALERS 3. AUCTIONS 4. OUTLOOK 48
正文与记录 · 第 71 页
Some experienced dealers commented that they felt the issue arose not only due to collector demand but because of the influx of ‘too many new galleries that have no integrity or knowledge of the business.’ Others felt that although most dealers attempted to manage artists’ careers for longevity, inflated prices at auction that did not match those in galleries were causing hype around certain artists. Some noted that ‘auction visibility was replacing museum acquisitions as a marketing technique for artists’ with works going from artists’ studios to the auction sector in a very rapid turnaround, rather than being exhibited first in galleries and museums before moving to the secondary sector (see also Chapter 3). Some dealers also saw the issues of fast-selling and overinflated markets as part of a resurgence of the trend toward a more financial focus in the art market over the last few years. ‘We have seen a resurgence of investment schemes and the use of inappropriate financial tools in the art market again in the last two years. When these things start to proliferate, it’s always a sign of trouble ahead.’ ‘One of the biggest issues now is the corporatization of the art world. Especially for young artists who need to have time to brew and make mistakes and grow without being eaten alive by the market.’ Although most concerns related to the primary market, dealers operating in the secondary market also noted that despite strong sales for specific, historically significant artists, the frenzy of activity some had experienced in 2021 had quietened in 2022, with collectors being choosier about sales and more competitive on prices. Although dealers in living and Contemporary artists’ works had higher year-on-year growth, their average turnover was still considerably lower than dealers in older sectors of the market, particularly those only dealing in the primary market (with the exception of those operating in non-fine art sectors such as antiquities, antiques, and decorative art). Among the survey respondents in 2022, Modern, Old Masters, and Post-War specialists all had higher average turnover than Contemporary art dealers. Dealers in antiquities, decorative art, and antiques had among the lowest average turnovers in this sample, but sales increased for these sectors in 2022. Combining sales of specialist dealers in these three areas (excluding any that also dealt in fine art), average sales rose by 14%, and like all sectors, performance tended to be better for dealers operating at the higher end. INDEX ↑ INTRODUCTION 1. THE ART MARKET 2. DEALERS 3. AUCTIONS 4. OUTLOOK 71
正文与记录 · 第 95 页
Slow-moving inventory, combined with rising costs and poor external financing to bridge the gaps, has been an ongoing problem for dealers over many years. During the pandemic in 2020, although most businesses experienced a significant drop in sales, the reduction of art fair, travel costs, and staffing produced leaner operating structures for some businesses, allowing them to maintain or even increase profitability in some cases. During 2020, the majority (54%) of dealers were less profitable than in 2019, but 28% increased profitability. In 2021, as sales picked up and galleries remained cost-conscious, there was a significant uplift in the number of businesses making more profit, with 55% more profitable than in 2020 and 24% less so. In 2022, although aggregate sales grew in many sectors, the presence of rapidly rising costs was evidenced in a significant fall in the share of more profitable businesses. As dealers came under pressure to maintain their bottom line, a minority were more profitable, and around one third saw their profits decline. Across all dealers during 2022: • 39% were more profitable than in 2021; • 29% were around the same as 2021; and • 32% were less profitable. Figure 2.23 Share of Sales by Inventory Status in 2022 ©Arts Economics (2023) INDEX ↑ INTRODUCTION 1. THE ART MARKET 2. DEALERS 3. AUCTIONS 4. OUTLOOK 95
正文与记录 · 第 118 页
Dealers’ anecdotal comments and views on art fairs in 2022 and their future were mixed. Some commented on the positive aspects of returning to fairs and doing more of their sales offline, as well as the increase in both geographical diversity and types of collectors at fairs, noting that travel had not seemed to be as much of a barrier to attracting buyers as it was in 2021. Many commented on escalating costs, both of the fairs themselves and the associated expenses of travel and entertaining, which in some cases had not balanced as favorably against sales as in previous years. ‘Post-pandemic, the costs of participating in art fairs has skyrocketed and it is becoming no longer economically viable for us to exhibit as they don’t bring in enough business to justify the high cost of a booth.’ ‘The ratio of the sales versus the costs to exhibit did not balance for us, and we will not do some of the same fairs next year. We will still visit these regions to see collectors but without taking on the huge costs associated with exhibiting.’ Figure 2.35 Average Number of Art Fairs by Year and Level of Turnover [电话已省略] ©Arts Economics (2023) INDEX ↑ INTRODUCTION 1. THE ART MARKET 2. DEALERS 3. AUCTIONS 4. OUTLOOK 118
正文与记录 · 第 142 页
INDEX ↑ INTRODUCTION 1. THE ART MARKET 2. DEALERS 3. AUCTIONS 4. OUTLOOK 142 at Christie’s New York in May as part of the sale from the estate of Swiss dealers Thomas and Doris Ammann. At a price of [金额已省略], the work became the second-most expensive work to ever sell at auction (next to Leonardo Da Vinci’s Salvator Mundi (c. [电话已省略]) sold for [金额已省略] at Christie’s New York in 2017). Georges Seurat’s Les Poseuses, Ensemble (Petite Version) (1888) sold for [金额已省略] at Christie’s in November as part of the collection of the late cofounder of Microsoft, Paul Allen – a record for the artist and for a Post-Impressionist work at auction. In the same sale, Paul Cezanne’s La Montagne Sainte-Victoire ([电话已省略]) sold for [金额已省略] – another artist’s record – along with Vincent van Gogh’s Verger avec Cyprès (1888) for [金额已省略]; Paul Gauguin’s Maternité II (1899) for [金额已省略]; and Gustav Klimt’s Birch Forest (1903) for [金额已省略]. Aside from setting price records for each of these artists, the sale on November 9 reached [金额已省略] billion, the highest-ever total for a single sale. Combined with a follow-up sale from the collection on November 10, the total of [金额已省略] billion was also the largest single-owner collection sale and accounted for 22% of Christie’s public auction sales revenue. In 2022, sales at public auction of fine and decorative art and antiques were stagnant, showing a slight dip of 1% to [金额已省略] billion All of the top 50 works by lot price were at Christie’s, Sotheby’s, or Phillips, and all sold at prices of above [金额已省略], leading to a record year for these three auction houses. Some other regional and national auction houses in Europe also reported strong sales, including larger mid-tier houses in France and Germany. However, the significant drop in the value of the Euro vis-à-vis the US dollar over the year presented a less favorable view of their performance when aggregated in dollar terms. Above average inflation in parts of Europe, particularly in the energy sector sparked by the war in Ukraine, and general worries about recession, all contributed to a major fall in the Euro against the relative safe-haven US dollar in 2022. The Euro dropped to a 20-year low during the year, falling from highs of over [金额已省略] in mid-2021 to below parity in September 2022. While exchange rate fluctuations are an issue every year when measuring sales, a much more significant drag on growth in the sector was the relatively poor performance of the Chinese auction market, with some spring auctions cancelled in Shanghai and lockdowns at the end of the year stalling several of the most important autumn auction sales in Mainland China, including those at major houses such as Poly Auction and Yongle.
正文与记录 · 第 165 页
INDEX ↑ INTRODUCTION 1. THE ART MARKET 2. DEALERS 3. AUCTIONS 4. OUTLOOK 165 45 Global rank measures the traffic rank of the website compared to all other sites in the world, with a lower number indicating an improvement in rank. (Companies are ranked in ascending order, 1 being the highest rank and lower ranks indicated by increasing numbers.) In the period from January 2017 to January 2022, according to according to data from NetCraft.com the number of active websites rose by 15.5%. Figure 3.9 Change in Global Website Traffic Ranking in 2017, 2021, and 202245 ©Arts Economics (2023) using data from SimilarWeb
正文与记录 · 第 189 页
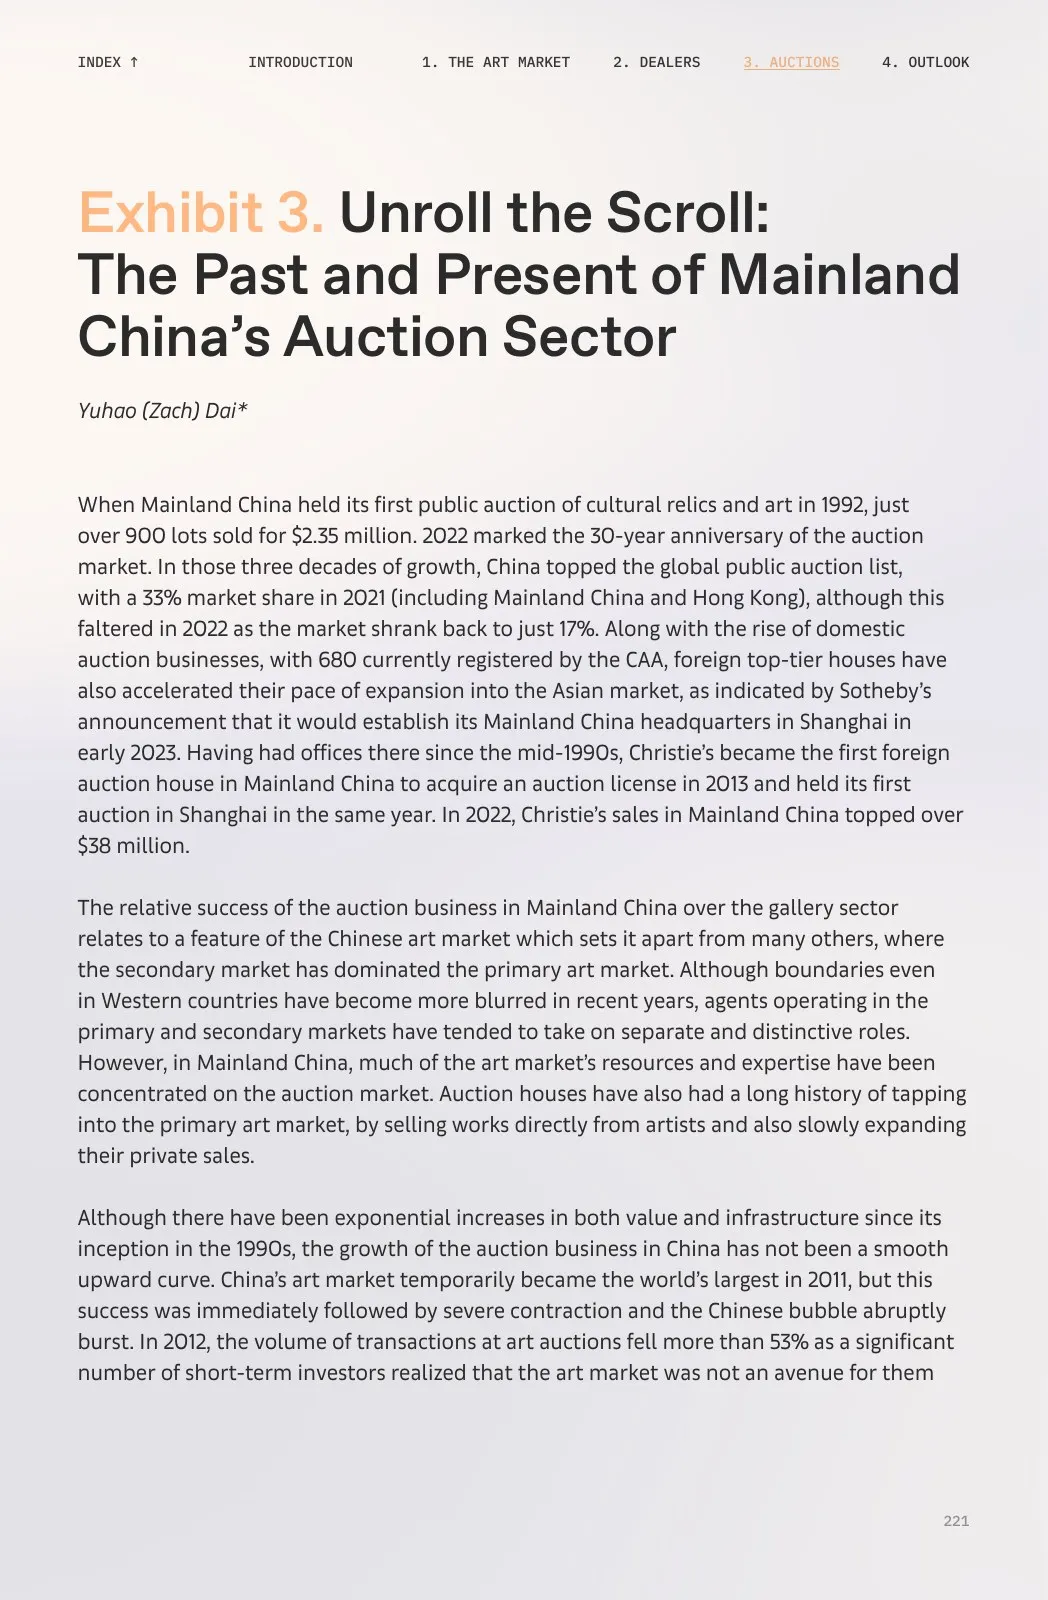
INDEX ↑ INTRODUCTION 1. THE ART MARKET 2. DEALERS 3. AUCTIONS 4. OUTLOOK 189 After a substantial decline in 2020, Post-War and Contemporary art sales in France reached their highest level in 15 years in 2021, increasing by almost 80% to [金额已省略]. However, measured in dollars, sales in 2022 were weaker, declining by 13% to [金额已省略], resulting in a slight fall in France’s global share by value to 5% (down by 1% year-on-year). Sales also declined in Germany and some other mid-sized markets in the EU, although performance was mixed with double-digit growth in smaller markets such as Belgium and Austria. After strong growth of close to 60% in 2021, sales in the EU slowed in 2022, declining by 14% in US dollar terms, with a stable share of 9% of global sales. IMAGE Carl E. Hazelwood, Welancora Gallery, image courtesy Art Basel
正文与记录 · 第 212 页
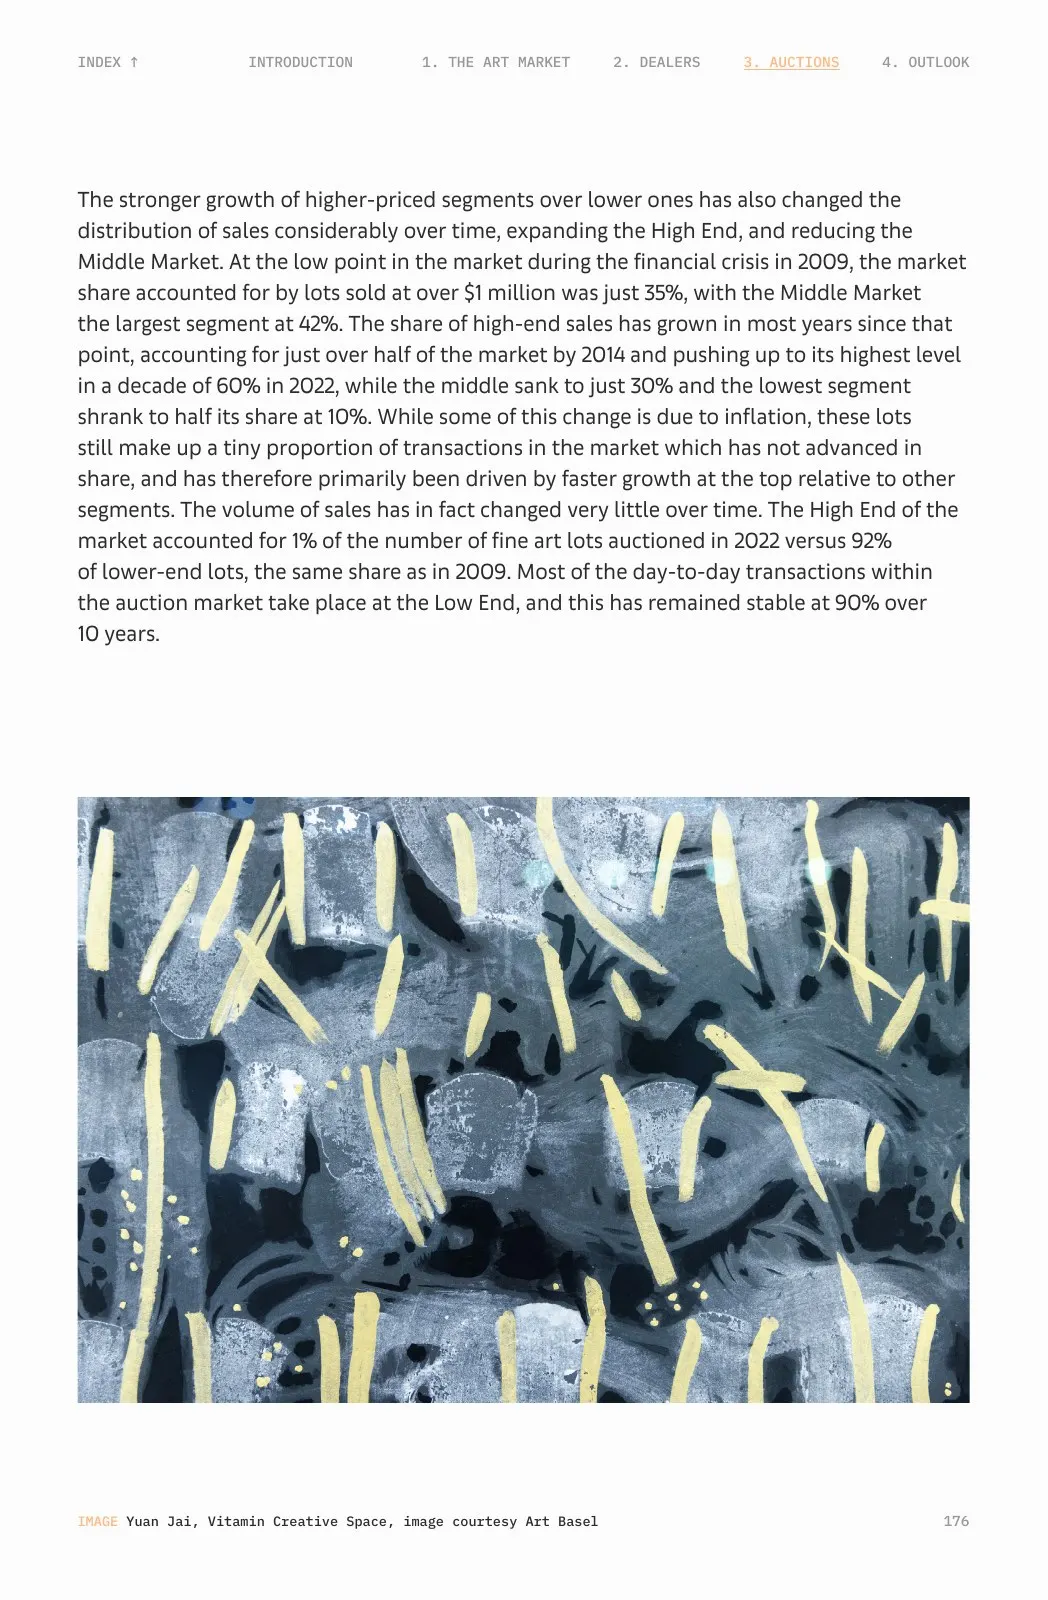
INDEX ↑ INTRODUCTION 1. THE ART MARKET 2. DEALERS 3. AUCTIONS 4. OUTLOOK 212 Figure 3.33 Share of European Versus Other Old Masters by Value 2013–2022 ©Arts Economics (2023) with data from Artory Like all sectors, values in the Old Masters market are driven by the availability of works coming onto the auction market. However, in this sector, the very thin supply of high- quality masterpieces that are in commercial circulation each year has limited growth, despite there being very ample demand and buyers willing to pay high prices when they do appear. While the market is slightly less affected by prevailing economic conditions, like other sectors, the restrictions and other factors related to the pandemic caused a decline in sales in 2020 by 16% to [金额已省略]. The sector recovered well in 2021 with values increasing by 21% to [金额已省略] billion, driven by sales of a small number of highly priced works with a much more moderate increase in volume (with the number of lots sold up by 9%). However, in 2022, while European Masters maintained growth, the cancellation of sales in China dragged down values in the wider sector and sales values fell by 17% year-on-year alongside a 10% drop in the number of transactions, bringing the market just above 2020 levels again at [金额已省略]. Although above the bottom of the market in 2018, the sector has shrunk in size and value over 10 years, with values falling by 37% from 2013 and the number of lots sold also down by 27%.
正文与记录 · 第 236 页
INDEX ↑ INTRODUCTION 1. THE ART MARKET 2. DEALERS 3. AUCTIONS 4. OUTLOOK 236 new and changing contexts, as well as to undertake the necessary organizational changes and innovations.⁵² Positive forward thinking and adaptability have undoubtedly helped many dealers and auction houses through the challenges of the pandemic, as well as promoting a greater recovery over the last two years for some businesses over others. However adaptable businesses have been, having the financial resources necessary to make changes has also been a critical factor in recovery. Many dealers commented that how financially prepared they were going into the crisis was pivotal to how they emerged. An outcome becoming clear in 2022 is that the pandemic and movement online did very little to level the playing field as many hoped, and if anything, increased the divide between the high and low ends of the market, with the position of some smaller businesses weakened through possibly not having had the same resources to deal with some of the challenges faced. Smaller galleries turning over less than [金额已省略] saw aggregate sales decline in 2022, and sales at auction under [金额已省略] declined on aggregate, including a drop of 14% for fine art under [金额已省略] – a much more significant component of sales for smaller businesses. These poor and volatile sales against a backdrop of rapidly rising costs has undoubtedly put many of these businesses in a difficult financial position. Further, as noted by some smaller dealers, their buyers have also been more affected by the cost-of-living crisis and fears of recession in the US and other markets, causing a strain also on demand. Apart from the size of businesses, there has also been a regional dimension to the challenges, with specific economic, political, and cultural issues in different markets. More generally, with businesses and collectors remaining present in and focused on their own regions during the pandemic, some smaller galleries and other businesses operating outside of the main art hubs may have faced greater challenges, and the unique conditions over the last few years marginalizing them further as the art trade (by value) continues to concentrate around global hubs. At the top end of the market, on the other hand, the growth of HNW and UHNW wealth has helped to support sales and generate growth. Since 2009, billionaire wealth has grown by over 380%, far outpacing the growth of the aggregate art market which has increased only around 75% between 2009 to 2022. However, focusing on sales over [金额已省略] at fine art auctions, growth has been close to 700%, showing that to the extent that advances in billionaire wealth have fed into the art market, they have most evidently been channeled into supporting the outsized growth of the high end. While this has buoyed the market as a whole, it presents a much less stable path of growth, and severely belies the pressure in other segments: the parallel rate of growth for the sub-[金额已省略] segment – where 92% of 52 Amore, Garofalo and Martin-Sanchez study of UK firms during the pandemic showed that those led by optimistic entrepreneurs had a higher likelihood of innovation and organizational changes, which were useful to weather the pandemic shock and translated into actual higher growth. They note however that if this optimism or self-belief is to the extent that it creates a false sense of control, it could also subject firms to biases and errors in judgment. See Amore, M. Garofalo,O. and Martin-Sanchez, V. (2022) ‘Dispositional Optimism and Business Recovery during a Pandemic.’ PLOS ONE 17(6), available at: doi.org/10.1371/ journal.pone.0269707.
正文与记录 · 第 259 页
Rights All rights reserved. No part of this publication may be reproduced, stored in a retrieval system, or transmitted, in any form, or by any means, electronic, mechanical, or otherwise without prior permission in writing from Art Basel and UBS. UBS accepts no liability for the actions of third parties in this respect. Disclaimer This document and the information contained herein are provided solely for general information purposes and have not been tailored to the specific needs, investment objectives, or personal and financial circumstances of any recipient. This document is not promotional in nature and is not intended to promote any products or services of UBS AG or any of its affiliates. It is not to be regarded as investment research, a sales prospectus, an offer, or a solicitation of an offer to enter into any investment activity. It is not to be construed as legal, tax, accounting, regulatory or other specialist or technical advice, investment advice, or a personal recommendation. Information provided herein with respect to this report, including any valuations and or financial results, has been provided by Arts Economics and Dr. Clare McAndrew. Neither UBS AG nor any of it its affiliates have verified the accuracy of the stated information or make any representations or warranties as to the accuracy or completeness of such information. Prior performance is not indicative of future results and UBS is under no obligation to update or keep current the information contained herein. Neither UBS nor any of its directors, officers, employees, or agents accepts any liability for any losses or damages arising out of the use of or reliance on all or any part of this document or any information contained herein. © UBS (2023). The key symbol and UBS are among the registered and unregistered trademarks of UBS. All rights reserved. UBS Financial Services Inc. is a subsidiary of UBS AG. Member FINRA/SIPC. Review Code IS2301732 259 INDEX ↑ INTRODUCTION 1. THE ART MARKET 2. DEALERS 3. AUCTIONS 4. OUTLOOK